Introduction:
Hey everyone! My name is Hritvi Deven Thaker. I go by the name Vi, I am a sophomore majoring in Biological Sciences in the Honors program at Rowan university. Apart from academics, I am a member and the senator of Rowan Rangeela which is the Indian Dance team. I also really love music and I have been learning Indian classical music since I was 4.
Being a STEM major, I am really excited to learn how digital humanities approaches can broaden the way I think, and analyze information. Through this course, I want to understand how digital tools and technology can be used to our benefit to understand ethics of our society and enhance my storytelling. I am hoping to learn soft skills in this class like analysis, thinking from different perspective and creating digital projects and I aim to reflect what I learn in this course here, in this blog.
FREE TOPIC:
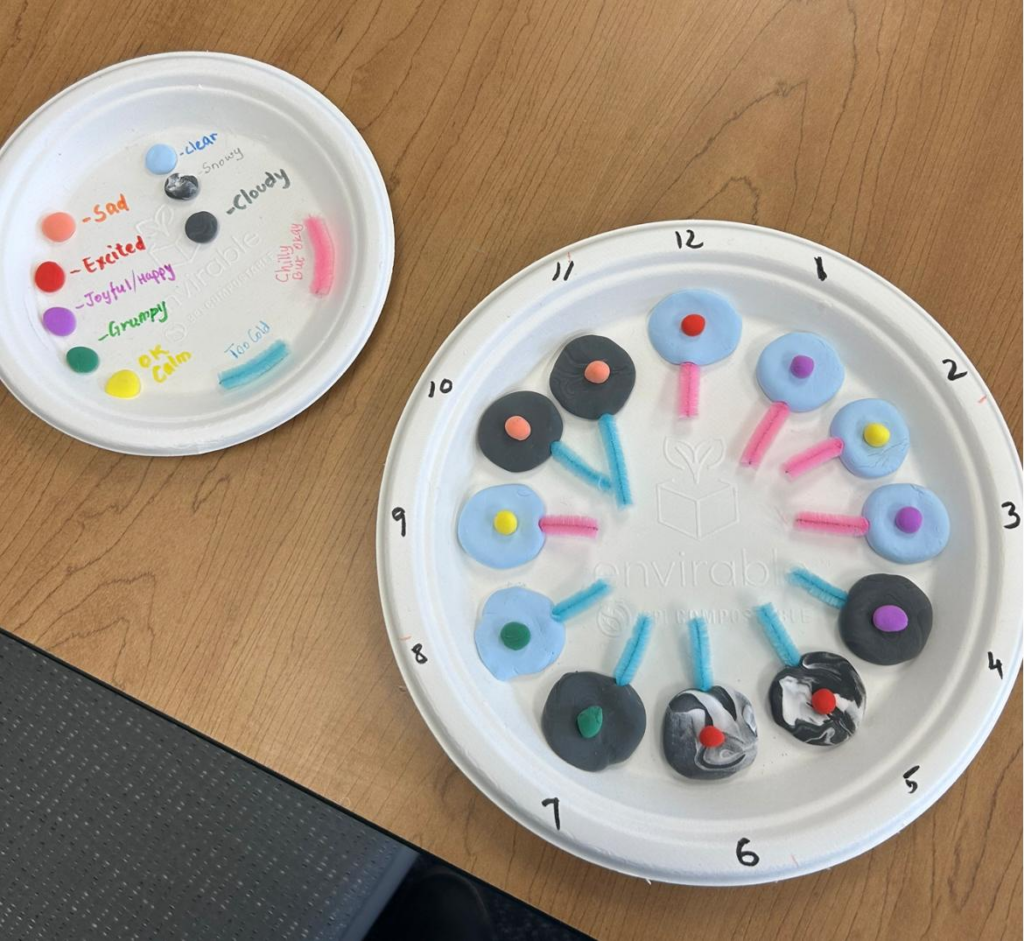
In this class, I have learned how basic human experiences can be noted down and converted into data. This data is later analyzed to try and find patterns that we usually ignore as we’re busy with our daily life. For my weekly data collection project, I had to track hourly informations about the sky, the temperature and my mood from morning 8 a.m to 7 p.m. At first, it was hard for me to remember, but adding little triggers throughout my day made it easier. During this activity, I noticed that I was reflecting on my mood and my feelings. I learnt that data does not always have to be numbers and charts, it cvan be experiences and feelings as well.
On recording both the temperature and my mood, I slowly was able to understand how external factors affect how I feel throughout the day. I understood how Digital Humanities bridge the gap between human life and technology and I learnt how digital tools can be utilized to our benefit.
MY DATA PROJECT UPDATE
This past week I have been tracking 2 things mainly
- Weather mood
- How music makes me feel
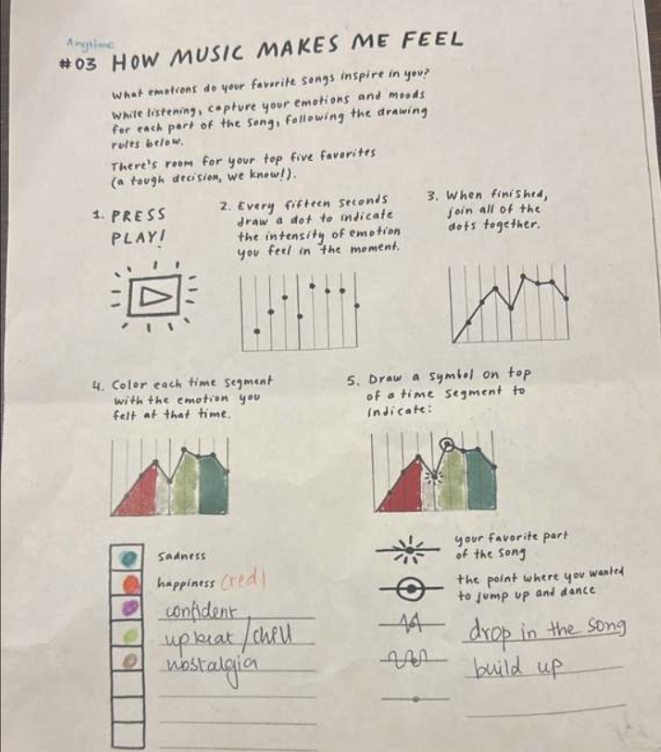
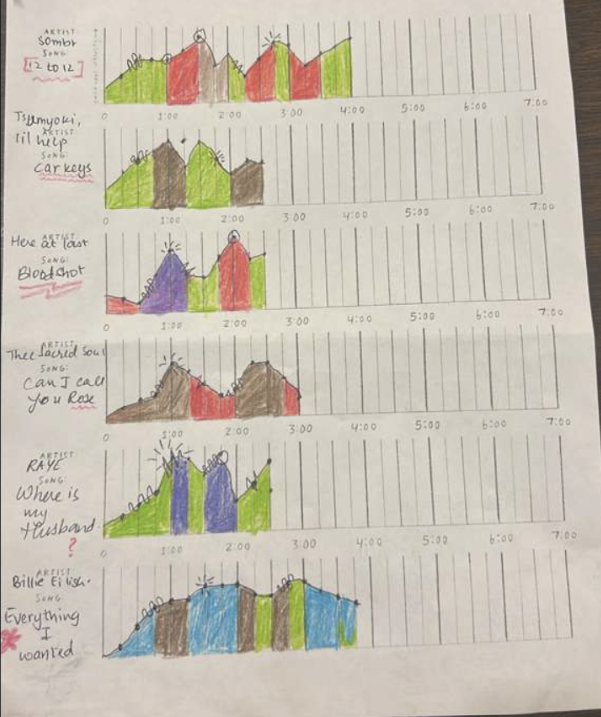
For the first project, I record the weather description (clear, cloudy, rainy), temperature , and a mood rating from 8 am to 7 pm. I’m tracking everything in my Notes app and transferring key pattern into the sheet given to us in the class. For the second, I tracked how music made me feel every 15 seconds. I noted down emotional shifts, favorite parts, and the exact moment in a song that made me want to dance. It was surprising how my mood changed with different tunes and beats.
For me, it was easier to note down emotions in music because I was listeing to music intentionally. Once I started paying attention, I realized how dramatically my mood shifts within a single song. It was comparitively harder to note down the sky and the temperature, especially when I was busy.
After one whole week of collecting data, I have noticed that most days were cloudy and very cold, and on those days my mood was noticeably lower, sluggish or not at its best. On days when it was much clear, eventhough it was cold, my mood was definitely better, I was more productive and felt more energized throughout the day. I can confidently conclude from this that mood is heavily affected by the weather.
For the music project, I tracked my reactions every 15 seconds while listening to selected songs. I awarely wrote down emotional shifts, favorite parts, and marked the exact second that felt like the “peak”. I also noticed that most songs have a similar pattern of steady start to a proper build up and then a pause or a drop and then the release that gives the dopamine rush.
Looking at my collected data visually on a paper makes it so much better to understand and I definitely enjoyed this process.
Reflection of Data Project
Hritvi Deven Thaker
Dr April Patrick
Intro to Digital Humanities
February 15, 2026
Data Project reflection
I always used to think of data as something that involved numbers, graphs, and measurements, usually on a spreadsheet, but this project gave me a new perspective and made me realize that data is easier to interpret when visualized correctly. Honestly, collecting data about myself for a week felt strange at first. I had to set alarms or triggers that reminded me every hour to track the sky. Every time I paused to record the sky, temperature, and my mood from 8 a.m. to 7 p.m., I became more aware of how often my feelings shift throughout the day and this influenced how I felt throughout the day. Normally, I would brush off my feelings aside, and I would go about my day, but tracking them forced me to slow down and give my feelings a label even when I didn’t have clarity.
I noticed a clear pattern after a week of tracking. I felt more grumpy and down on gloomy days and when I had 8 a.m. classes. I always assumed that I would not be that affected by the weather, but I noticed several times over a few days that showed a clear pattern. The data also showed that my mood was also determined by other factors like stress and music and that is why I chose my second project about how music made me feel
The music project was my anytime project and it felt personal for me as it often forced me to break away from an experience that I usually treat as immersive. Pausing every 15 seconds to assign an emotion, a symbol, and a color made me notice the structure of songs in a new way. I started predicting the build-up, and the sections that made me want to dance and the drop. What surprised me most was how consistently the drop ended up being my favorite part. I had never consciously thought about it before, but seeing it repeatedly in my data made it obvious that I get a dopamine rush right after the drop of beat.
I realized that it is important to have a set key or a legend to make the process easier. Otherwise, it gets overwhelming to keep track of all the data. Having consistent time intervals and a set of mood categories and colors are some legends that helped me. That helped me avoid overthinking every entry. But other choices like the 15-second pauses in the music project, made it a bit difficult. They broke my flow of listening and sometimes made my emotional labels feel forced. I also realized that picking a single emotion every 15 seconds was not enough because sometimes I felt multiple things at once, and it was hard for me to label my emotions.
I learned that I’m more influenced by environment and music than I thought. I learned that my favorite moments in music are not random, they follow a pattern, and I’m happier on clear, sunny days. Moreover, I learned that data about personal experience is never completely unbiased.
Choosing texts for Distant Reading
For my Distant reading project, I chose Charles Darwin’s On the Origin of Species as my main text.I will be using seven chapters from On the Origin of Species as my corpus. I will be treating every chapter as a separate text so that I can compare how Darwin’s language changes across different parts of his argument while still working with one consistent narrative. I was able to find an open-access version of the book on Project Gutenberg. I chose this text because I am a Biological Science major, and I’m interested in biotechnology and genetics and wanted to try and connect this project with my major. Darwin’s work is usually considered foundational, and it would be easier to work with it. I have learnt basic concepts like natural selection and about Darwin’s finches, but I have never actually read Darwin’s original text, so using distant reading feels like a good way to explore it without getting overwhelmed by the length. I also think it will be interesting to see and understand how scientific theory is built with the help of repeated terms. I assume that earlier chapters about domestication will focus more on human influence and breeding, while later chapters will use more technical language about relationships between organisms like hybridism. Based on what I already know, I expect words like variation, selection, species, and nature to come up frequently. I believe that analyzing these chapters simultaneously might help us understand how Darwin gradually develops his argument and what concepts he relies on most heavily. Moreover, I am very excited to work on this project.
FREE TOPIC
I planned to take up a book written by Charles Darwin. I chose first seven chapters and grouped them into similar topics and cleaned them as in- I got rid of words that were too repetitive. Then, I took those groups and made word clouds (which was a fun process).For this project, finding sources was easier than I expected. At first, I assumed any version of On the Origin of Species online would be the same, but when I opened the Project Gutenberg link, I realized it was the sixth edition, not the first. I had to think what counted as an ‘original text’. Using Project Gutenberg itself was actually very convenient because the texts are free, searchable, and clearly labeled once you know where to look. It also felt interesting to read a scientific work in its historical language because the tone and structure are very different from today’s textbooks. I think it is very different from the textbooks we read today. At the same time, the older writing style made me pay closer attention and read more carefully.
DISTANT READING PROJECT REFLECTION
Hritvi Deven Thaker
Dr April Patrick
Intro to Digital Humanities
March 1st, 2026
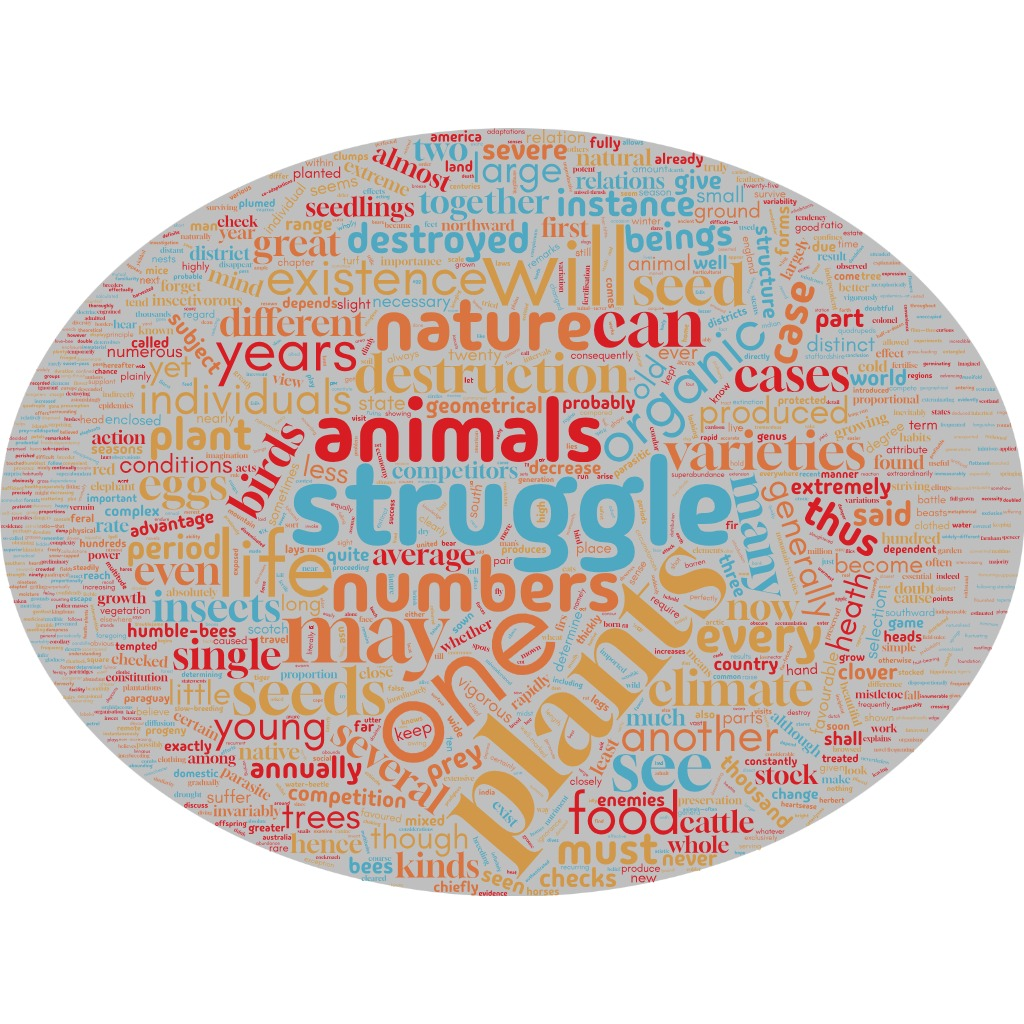
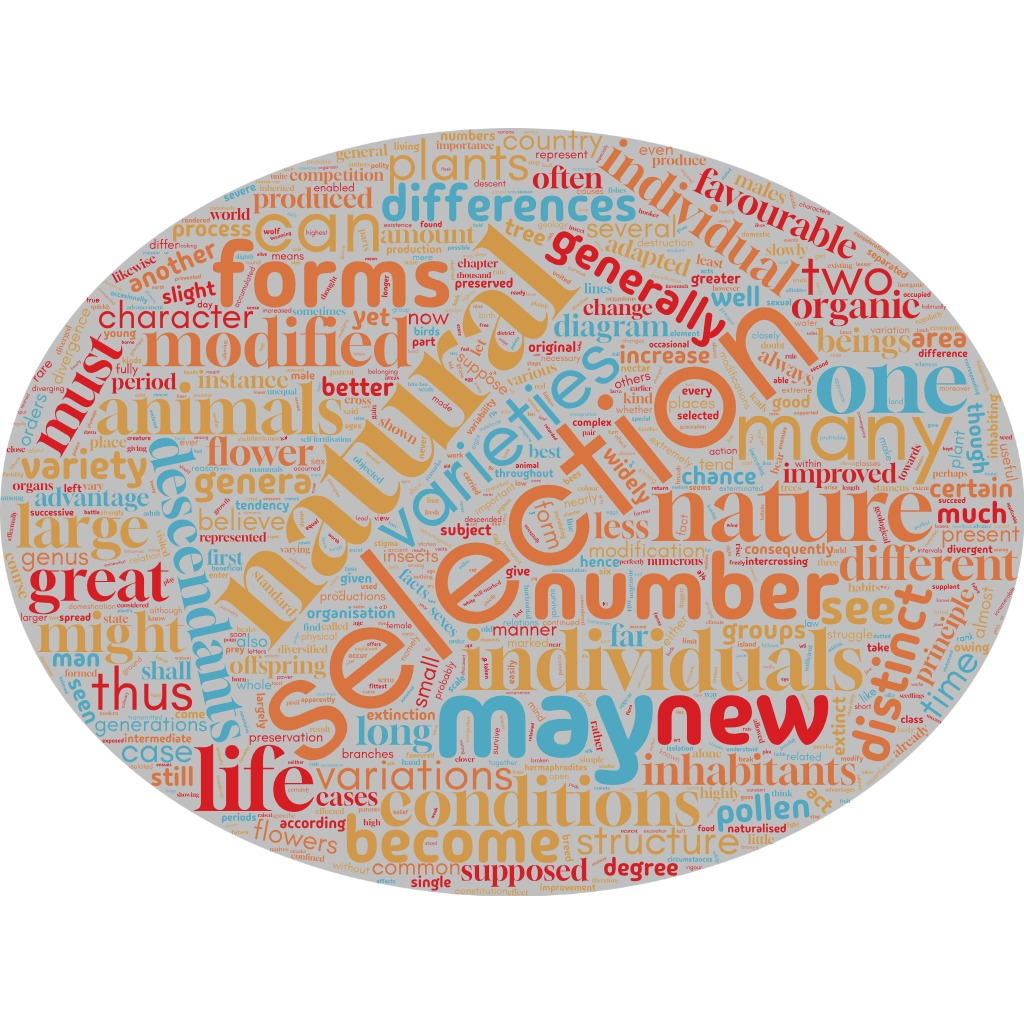
This was a very interesting project and it was very surprising when I was instructed not to read the text I had chosen. For this project, I analyzed the first seven chapters of On the Origin of Species by Charles Darwin and skimmed through it. I had some preconceived notions about what it is going to be about. I predicted the text would focus on natural selection, evolution, and how species develop through different environmental and biological factors. I expected early chapters on domestication to emphasize human influence, while later chapters would use more technical language. And since this text is written in 1859, I expected the language to be like old english but surprisingly, it wasn’t that difficult to understand. I grouped the 7 chapters and ran each of them in Wordcloud, which is a really cool tool. The word clouds highlighted the frequent repetition of words like “species,” “varieties,” “selection,” and “nature,” confirming my assumptions.
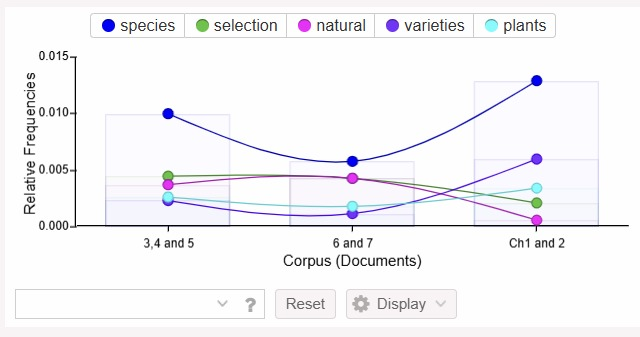
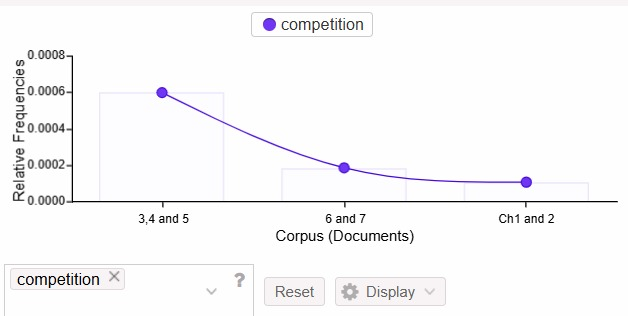
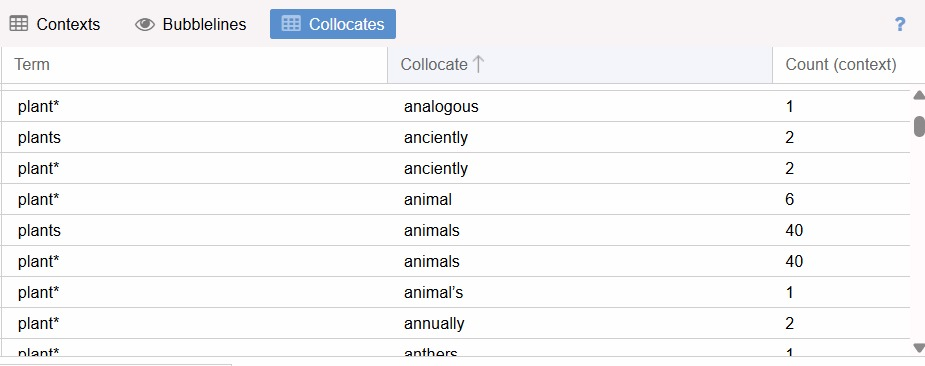
When I ran the same chapters through a tool called Voyant, the graphs generated frequency graphs showed how certain words appeared more often in specific chapters, suggesting shifts in Darwin’s focus. For example, “species” appeared consistently, while words like “plants” and “selection” varied depending on the chapter. By doing this project, I learned how tools like WordClouds and Voyant can reveal patterns in a text without fully reading it.
chapter 3
chapter4
Wikipedia Experience
I remember vividly using Wikipedia for the first time when I was in 6th grade. I was fascinated at first how every topic had a lot of information and back then, I was a very enthusiastic reader and really curious about everything. Wikipedia felt like everything was within my reach. I have mainly used it for pop culture references, and lot of non academic topics like history of a place, to cross-check whether a fact was true or not and what fascinates me is how I could go from one link to another from a single page and to me it was like flipping pages but only that each page was an entire new book. This project is a very interesting one as I get to contribute to something that always felt majestic and I am looking forward to it!
Free Topic
Over the past two days, there has always been a thought in the back of my mind and that is: Am I choosing the right topic for my WikiPedia project? I know that there are no ‘right’ topics to choose from but being a bio major, I wanted to edit/ add entries to a topic related to my major of course and the topics can get a little overwhelming with the amount of information. I am sure that no matter what topic I choose, I will have to conduct extensive research and make sure that all the information I plan to edit is true. I feel that everyday clsas discussions help mne out a lot and I think this project is both exciting and nerve wrecking because I cannot fathom the fact that actual people all around the world will be able to see my edit which is mindblowing.
FREE TOPIC
During spring break, I saw the Frankenstein movie that came out last year and I could relate many scenes with what we discussed in class. Also, I found myself thinking about how differently the story can be experienced across mediums. In the book, I was more drawn to the Creature’s perspective and his gradual development, especially how rejection shaped his actions. The novel allowed me to slow down and really understand the emotions and intentions of both Victor and the Creature, the desire for connection and the lonliness that drives much of the conflict whereas the film, on the other hand, made the story feel more immediate. The movie made me focus more on Victor’s narrative and the consequences of his ambition. I think there was a shift in the interpretation even though the main plot remained the same.
This made me realize how adaptations reshape how we interpret them. This highlights how meaning is influenced by a medium, and how modern formats can both reveal and obscure different layers of a classic text.
Finishing Wikipedia Article and Project
1. My Wikipedia article is about chromosomal inversion is nearly complete and I am glad that it looks good enough. In the beginning, I thought that this project was going to be overwhelming but breaking down a big task into smaller assignments and with constant guidance and support from our professor was relieving.Since chromosomal inversion is a scientific topic, I want to make sure the formatting is clean and consistent with Wikipedia’s style standards, and that the information I added fits naturally within the existing article.The majority of the research and writing is done, and the only part remaining now is formatting and cleanup, along with peer review and feedback, before it gets published.
2. My feelings about the project are mixed because I’m proud of how much I’ve put into it, but also aware that there’s a few finishing touches left. I am also a bit nervous because what if another Wikipedian removes all my changes? That would be disappointing. Honestly, writing for a real, public platform like Wikipedia felt different from a typical class assignment. Knowing that someone could actually stumble across this article and read what I contributed made me want to be especially careful and accurate. It also made me feel like I was contributing to something bigger.
3. Through this project, I learned a great deal about chromosomal inversion and how different techniques help detect it. From traditional methods like karyotyping and G banding to more modern techniques like fluorescence in situ hybridization (FISH) and whole-genome sequencing, I realized how advanced the field is. Researching a niche scientific topic also made me push myself and review research papers and articles, which were difficult to read. Soon enough, I realized that not all online information meets Wikipedia’s standards, and I had to learn to distinguish between peer-reviewed, reliable sources and sources that looked credible but were not actually reliable.
500 Word Reflection of the Wikipedia Project
Link to the Wikipedia page- https://en.wikipedia.org/wiki/Chromosomal_inversion
When I first got to know that our project involved editing Wikipedia, the platform that millions of people around the world use every day, the thought was intimidating at first. Wikipedia has always existed in my mind as this vast resource, and the thought that I, as a college student, would be contributing to it felt like a big responsibility. My first thought was, where would I even begin?
The topic I chose for this project was Chromosomal Inversion. It is a genetic concept describing a segment of DNA that has been flipped in orientation within a chromosome. It is a niche topic, which made it both interesting and challenging to work with and so I had room to make some meaningful contributions. I expanded the article by adding examples and their respective links of different cytogenetic techniques used to detect Chromosomal inversion and by elaborating on linkage disequilibrium, I tried to make the edits more useful to readers with various levels of knowledge. To do this with responsibility, I had to read primary sources, journal articles and scientific literature but since it was a niche topic, it was a bit challenging to find reliable resources.
What I learned through the research itself surprised me. Chromosomal Inversion turns out to be far more relevant to genetics, evolution, and medicine than I initially thought. When I was going through the primary sources and understanding an entirely new concept, I realized that I was able to connect a few concepts with what I am learning currently. So I think it made me realize how important it is to be able to make connections amongst topics and look at it from a neutral point of view and to make sure that there is no bias created. That process gave me a much richer and deeper understanding than I ever expected to gain from a single class assignment.
Initially, I thought that making such an important edit would be a complex process, but working within Wikipedia’s structure turned out to be easier than expected. I got constant guidance from our professor and the WikiEdu training modules were genuinely helpful. They broke down complex topics to manageable tasks, and being able to practice in the Sandbox was convenient. I learned how to format citations correctly within Wikipedia’s system, how to evaluate sources against Wikipedia’s standards for reliability, and how to write in an encyclopedic tone that is clear and neutral rather than argumentative or personal.
Still, the most nerve-wracking moment was hitting “publish.” Writing for a public platform felt far more exposing than submitting work to a single professor. My words would be accessible to students, researchers, and curious readers around the world. Yet alongside that anxiety came an unexpected feeling of pride. I had contributed something accurate and useful to a resource that people actually rely on. That sense of purpose made the difficulty worthwhile.
This project was different from anything I had done before. When I realized that this was an edit or an entry on a page that was public, there was a shift in my perspective, and it made me more mindful, more thorough, and more invested in the work than I expected to be.
IDEAS ABOUT THE CYO PROJECT
Since my last project was on chromosomal inversions, I wanted to stick with a related topic and go deeper into that area. Basically, how basic changes in chromosome structures, like inversion, affect human evolution and disease. I’m drawn to it because I think it is really interesting how something invisible, like a small segment of DNA, can end up changing the entire function, whether it is being linked to cancer or the color of your eyes.
From my previous Wikipedia project, I already have a decent understanding of how inversions work, how they form and what effects they have. But, I want to really learn more about how, across time, scientists were able to detect variants and how they were able to figure out which ones are helpful, harmful across human populations.
I think there is a lot of confusion amongst people when it comes to terms like genes, genome, and DNA. I believe that it is important to fill in that gap since it is literally the building block that decides our lives. For this project, I aim to create an interactive map, or more like a timeline, that helps visualize variants across human populations and gives basic definitions to avoid any confusion.
Intro to Cleaned Data:
What is genetic variation and how does it vary globally?
So for this project, I went down a pretty deep rabbit hole into human genetics and how it varies across different tribes around the world. The data was way more interesting than I expected.
The basic idea is that not everyone on Earth has the same DNA. There are tiny differences in our genes, called alleles, and scientists can track how those differences are distributed across different regions and populations. For my dataset, I pulled information from three peer-reviewed studies that compared genetic diversity across Africa, China, and Europe, using a lot of genetic markers. What I recorded from each source includes things like what percentage of the world’s known alleles show up in each region, how much unique genetic variation each population has, and how diversity shifts the further you get from Africa. That last part is honestly the coolest trend in the whole dataset: genetic diversity decreases the farther a population is from Africa. So African populations don’t just have more diversity, they have a lot more, about 75–81% of all known genetic alleles globally, compared to just 53–57% in the Americas.
Basically, it’s strong evidence that humans originated in Africa and migrated outward over time.
Cleaning Data
For my CYO project, I had collected a lot of academic articles and primary sources. I needed to clean and organize them to pick the right reference and data from it. For my project, I have collected a few primary articles that depict variation in genetics around the world. I thought it was a very interesting topic but unfortunately it was so broad that I had difficulty deciding what to compare exactly. The cleaning process required me to decide on what to compare and in what quantities. I found sufficient data to be able to compare genetic variations among different tribes across the world that are situated at different coordinates.
I am cleaning the data by grouping a bunch of different tribes with genetic variation and finding their respective geographical coordinates. I also got rid of tribes that were too close and did not vary as much.
This process was actually not that bad, honestly. Google Sheets was giving me a bit of a hard time but I am used to it at this point. I mostly used Google Scholar to find these sources. One part that I felt was hard to do was to try and not get overwhelmed with the amount of data. Because with the amount of information, I feel it is easy to go off track.
Some of the general trends I noticed was that the tribes were placed more randomly and a but away from the populated cities globally. I think my data can be visualized by mapping out the different tribes. I also think it would be interesting to compare the map that I create with a map that depicts genetic variation amongst non tribal populations.
FREE TOPIC 6
This week, we finally got into putting our cleaned data into Omeka. This is a platform that will convert our data into a website. My project requires cleaned data to be converted into a map to be able to compare the genetic variation across the world among different tribes and populations. Working with Omeka took me a while to get used to because I had to put in each tribe with the correct coordinates and give a description for each population. I think this is a very versatile platform. So far the process of building of my project is going pretty smoothly. I am excited to see how the rest of the process goes on because I am sure this requires a lot of polishing and editing.